
By Ziyi Low //
 Greenery is recognised as an important part of urban landscapes, particularly for its benefits to our mental health [1], as well as its role in supporting wildlife [2] and cooling urban areas [3]. However, the significance of urban vegetation in storing carbon from the atmosphere remains under-studied, and it is often neglected in carbon accounting [4].
This project aimed to produce an inventory of the vegetation on campus and estimate the amount of carbon stored within trees, shrubs, hedges and herbaceous plants. The resulting dataset could then form the baseline for future monitoring with high spatial detail, and perhaps inform landscape management decisions on campus.
Throughout the project there was plenty of freedom for me to develop research ideas alongside my supervisor, from the conception of the project to the fine details when carrying out fieldwork. This was challenging at times due to the amount of responsibility involved but being pushed beyond my usual capabilities was highly rewarding.
After two months of hugging every tree I could get to on campus (over 500 trees) with diameter tapes, tracing over Google Earth imagery, and searching for the right equations to turn these measurements into carbon content, we have estimated that the amount of carbon stored in aboveground vegetation is 73,100 kg. This equates to 268,000 kg of carbon dioxide absorbed from the atmosphere, roughly amounting to emissions from 50 average UK residents in a year [5]
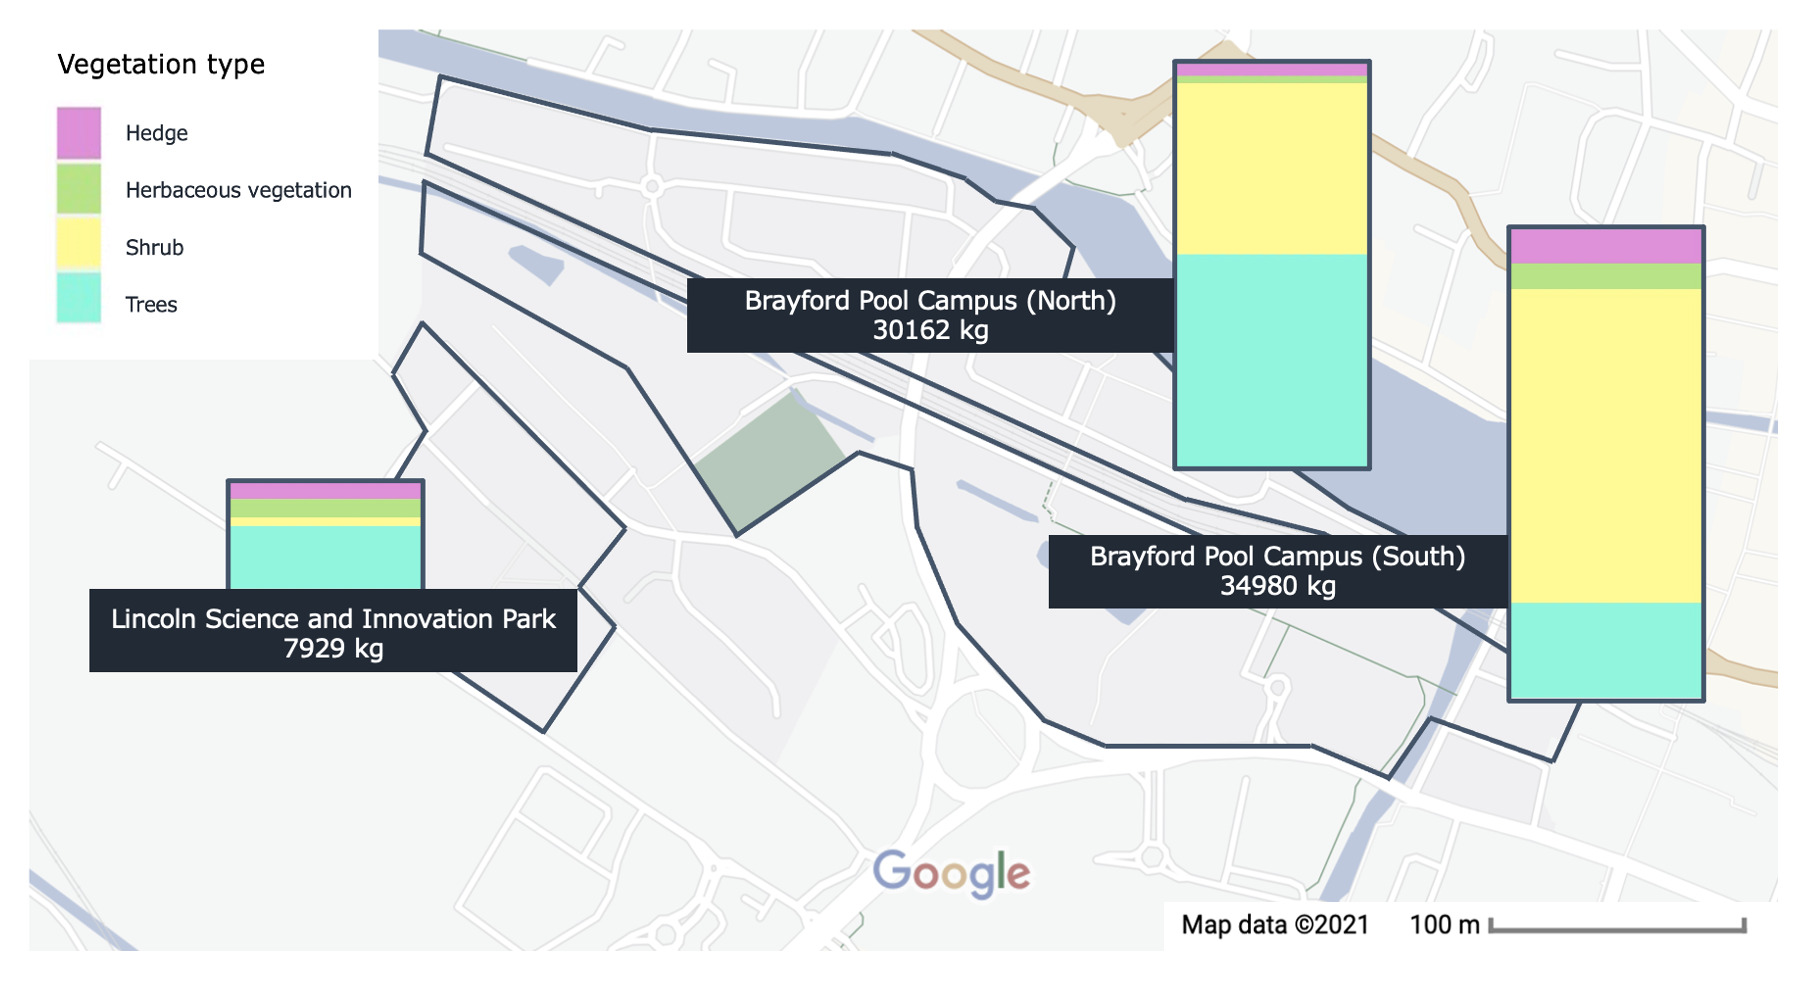 Half of the carbon store was in shrubs, which were mainly found along the railway, while trees accounted for 38%, hedges 6.3% and non-woody vegetation 5.3%. Most of the trees were small (containing up to 125 kg of carbon), so the tree carbon stock was smaller than one may expect. Hedges also contain high amounts of carbon relative to their area of growth, but they currently occupy just 0.68% of the project area, so establishing more hedges may be a space-efficient way to encourage carbon storage on campus.
A few unexpected difficulties were encountered, particularly during data collection. I anticipated measuring tree diameters to be fairly straightforward, but there were many factors to consider for our dataset to be useful in future monitoring, from deciding where to measure low-branching trees to finding ways to pass measuring tapes around vines and large insects.
A highlight of this project was being able to collaborate with my supervisor and benefit from her expertise and experience, while liaising with a variety of people, from the estates department to the university’s landscaping team has given me more confidence in communicating with others and asking for help when I need it. 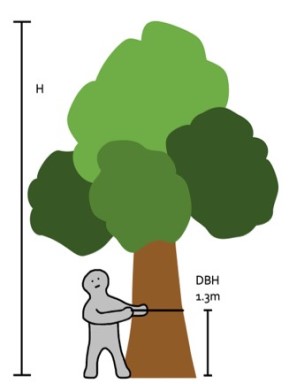
Undertaking a UROS project has been a fulfilling experience, and it has given me a better idea of what a research career may entail. I am grateful to my supervisor Lainie, Rebecca and Jack from Estates, Simon from Four Oak Landscapes, and Emma and Jack for their patience and assistance throughout this project.
*To view Ziyi’s research poster and presentation recording, please click on the thumbnails below:
References:
[1] Dobson, J., Birch, J., Brindley, P., Henneberry, J., McEwan, K., Mears, M., Richardson, M. and Jorgensen, A. (2021) The magic of the mundane: The vulnerable web of connections between urban nature and wellbeing. Cities, 108 102989.
[2] Kowarik, I., Fischer, L.K. and Kendal, D. (2020) Biodiversity Conservation and Sustainable Urban Development. Sustainability, 12(12) 4964.
[3] Susca, T., Gaffin, S.R. and Dell’Osso, G.R. (2011) Positive effects of vegetation: Urban heat island and green roofs. Environmental Pollution, 159(8–9) 2119–2126.
[4] Hardiman, B.S., Wang, J.A., Hutyra, L.R., Gately, C.K., Getson, J.M. and Friedl, M.A. (2017) Accounting for urban biogenic fluxes in regional carbon budgets. Science of The Total Environment, 592 366–372.
[5] World Bank and CAIT (2018) CO2 emissions (metric tons per capita) – United Kingdom. Available from: https://data.worldbank.org/indicator/EN.ATM.CO2E.PC?locations=GB [accessed 3 September 2021]